Connect to Ethstats network monitor
Connect to Ethstats to display real time and historical statistics about the network and nodes. You can connect to the Ethstats dashboard by connecting to a client and server or by connecting through the command line.
Components
Ethstats consists of:
- A server, which consumes node data received from the client.
- A client, which extracts data from the node and sends it to the server.
- A dashboard, which displays statistics.
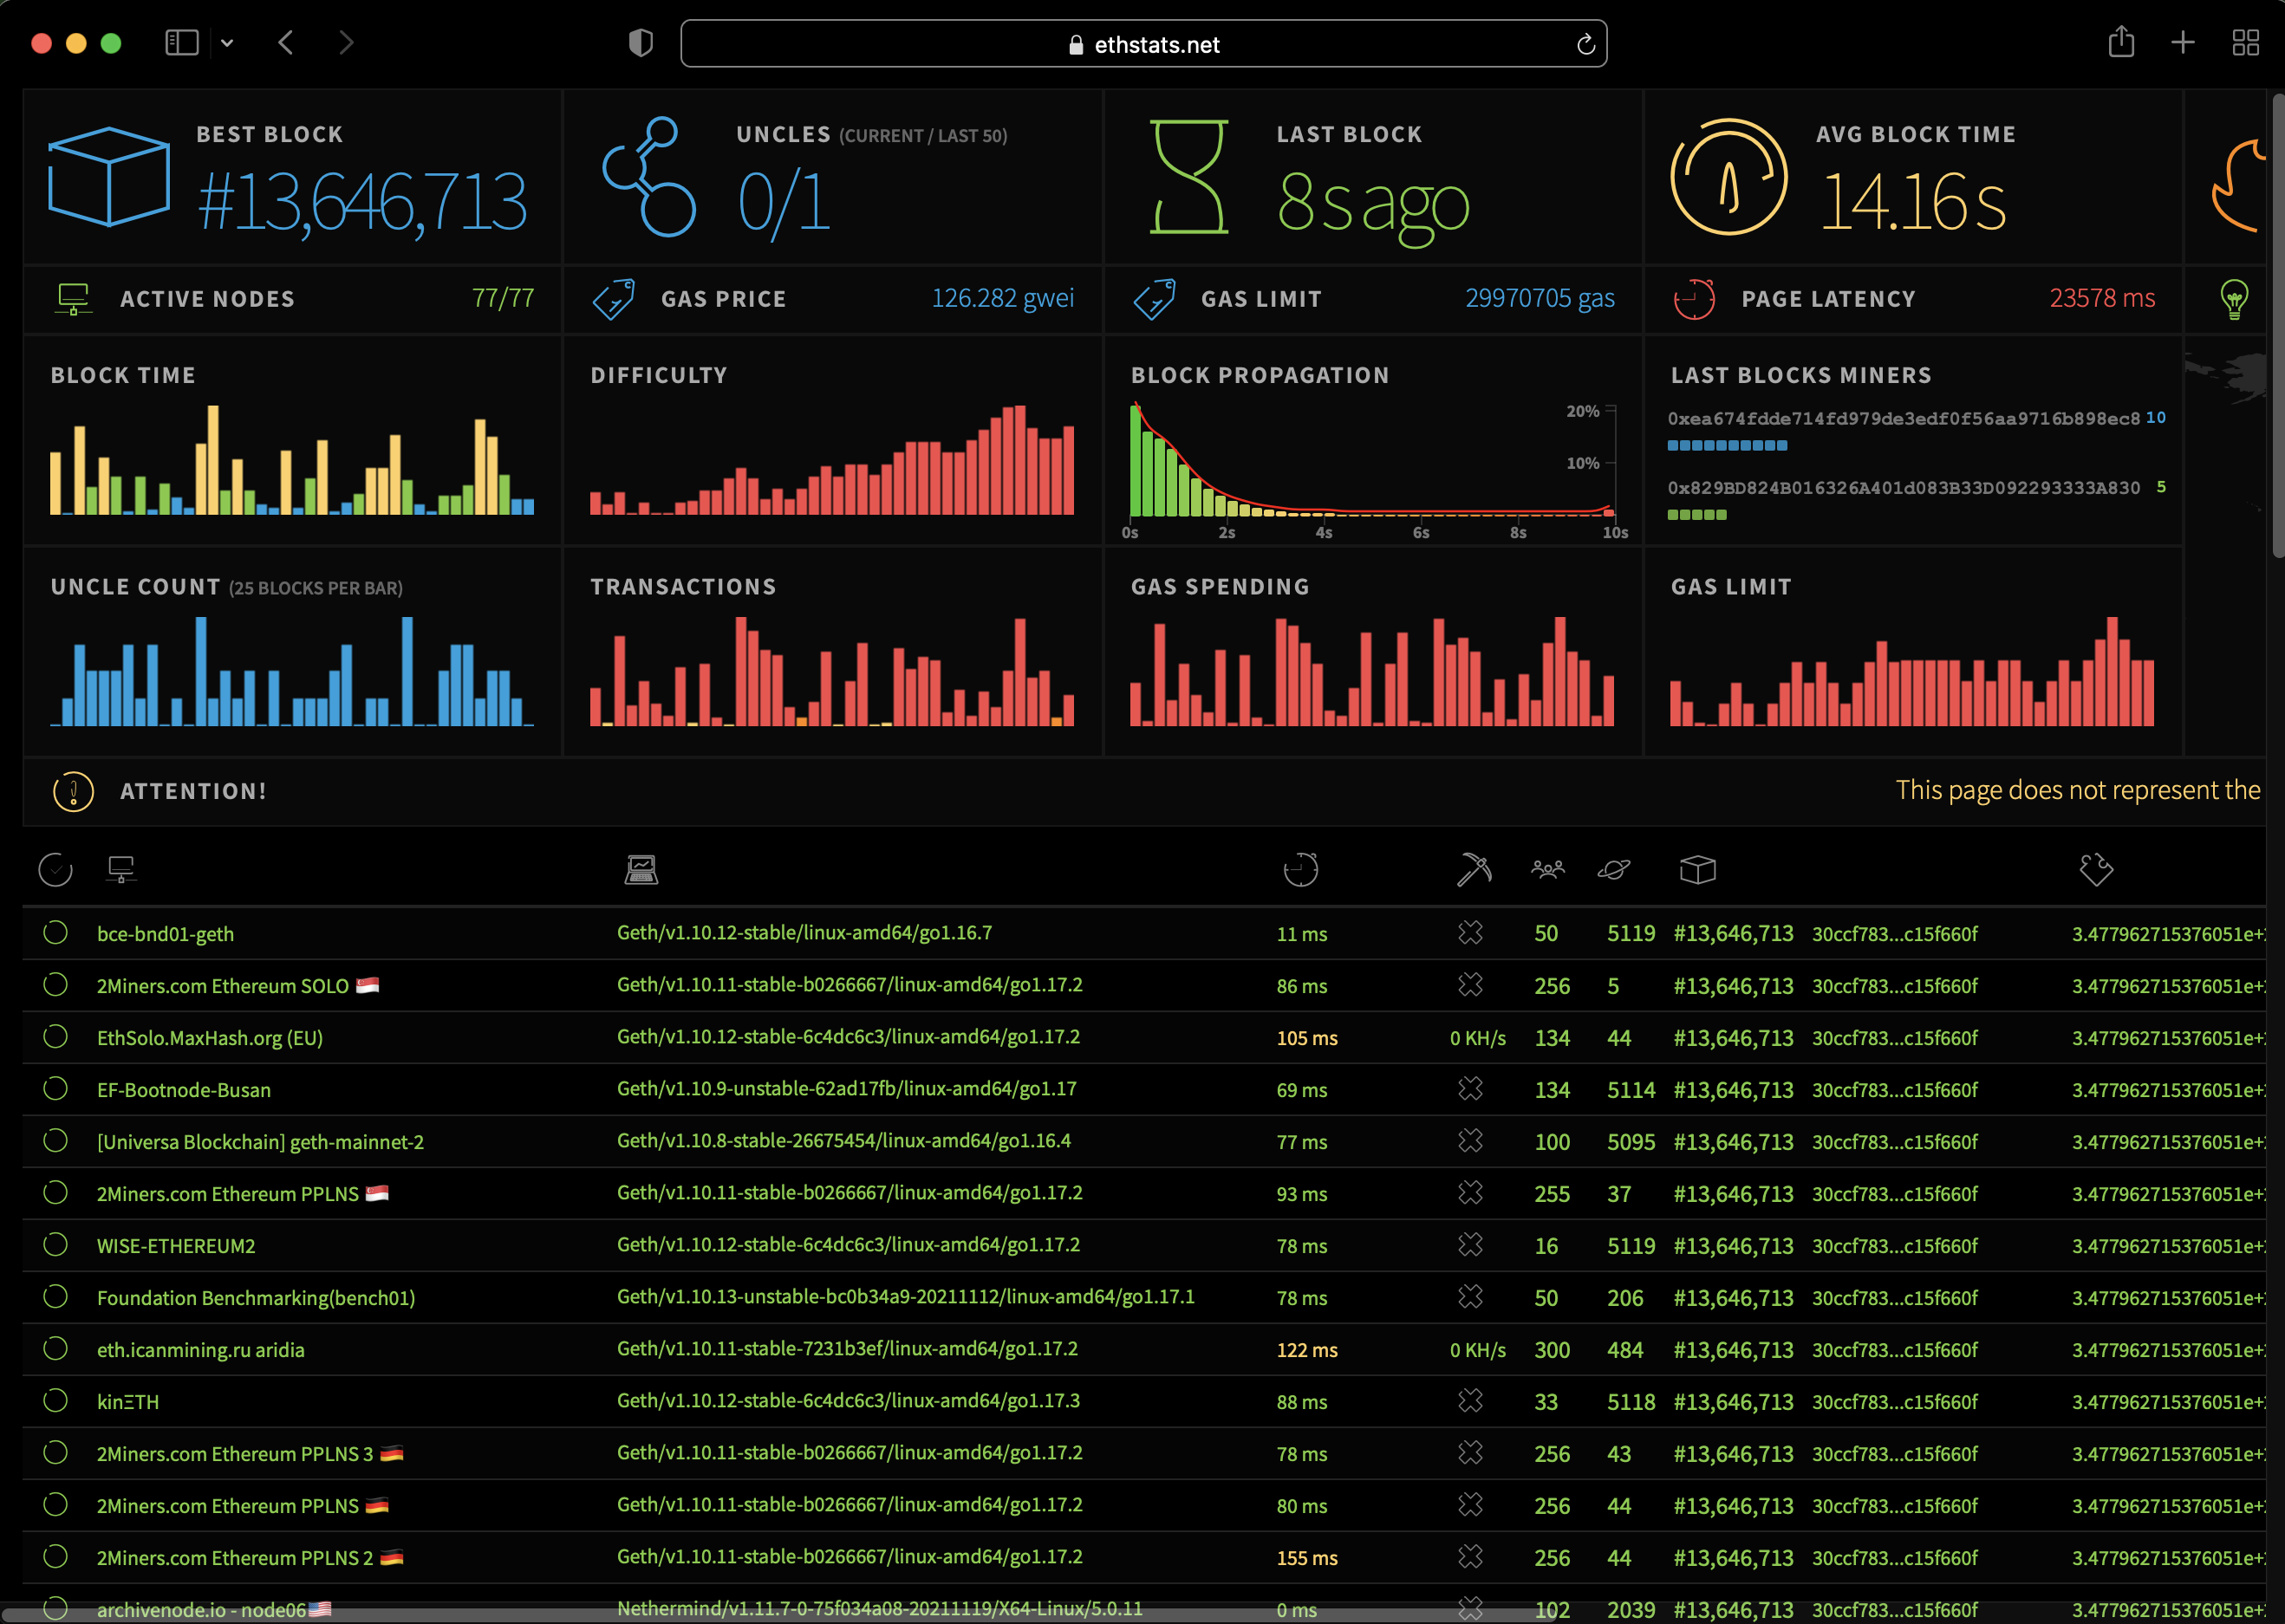
Statistics
Statistics displayed by Ethstats include:
- Nodes in the network. Metrics for nodes include:
- Information about the last received block such as block number, block hash, transaction count, uncle count, block time, and propagation time.
- Connected peers, whether the node is mining, hash rate, latency, and uptime.
- Charts for block time, block difficulty, block gas limit, block uncles, block transactions, block gas used, block propagation histogram, and top miners.
- IP-based geolocation overview.
- Node logs, which display the data sent by a node.
- Block history, which provides the ability to go back in time and playback the block propagation through the nodes.
Connect through a client and server
Refer to the external Ethstats client and Ethstats server documentation for installing those components and connecting to a dashboard.
Connect through the command line
You can use command line options to connect a node directly to a dashboard, without using a client.
Start a node using the --ethstats option to specify the Ethstats server URL. You can specify a contact email to send to the server using --ethstats-contact.
besu --ethstats=Dev-Node-1:secret@127.0.0.1:3001 --ethstats-contact=contact@mail.com
A server must be specified by --ethstats in order to use --ethstats-contact.
Open the selected dashboard website. Find your node under the list of nodes to see the statistics for the node and the network.